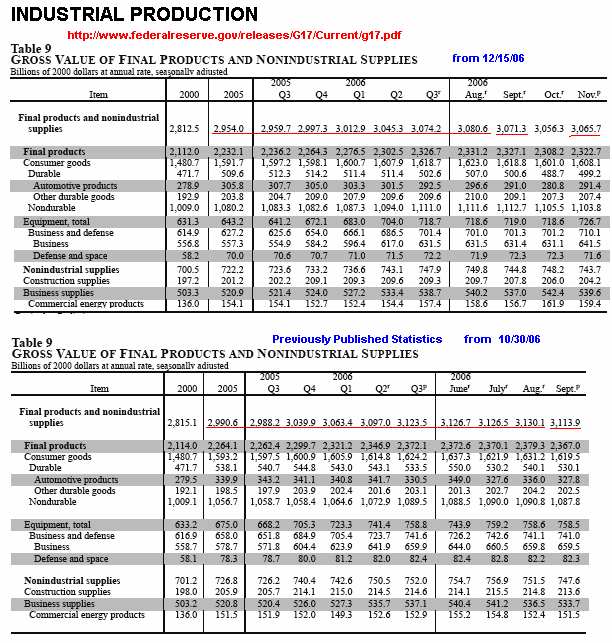
Today's Industrial Production "increase" of 0.2% is another example of the Federal Reserve manipulating statistics to make currently published figures appear "good" or "improved." From the Fed's own publication of Industrial Production figures taken from 10/30/06, the "Gross Value of Final Products and Nonindustrial Supplies" has been downwardly revised for every single time period shown. Every quarterly report has been revised downward. August and September's numbers have been downwardly revised. Even the total for 2005 has been downwardly revised by $36 billion, from the previously reported $2.990 trillion down to $2.954 trillion. (This would subtract approximately 0.1% from 2005's reported GDP.)
Even using only the current numbers, there has been a $15 billion net declinein Industrial Production since August. However, using the previously published number for August of $3.1301 trillion, there has been a decline of $64.4 billion to November's $3.0657 trillion. This is a decline in the annual rate of over 2% in 3 months. (Below is a modified copy of both the Federal Reserves report from 12/15/06 on Industrial Production on the top with a copy of the Fed's report from 10-30-06 on the bottom. The changed numbers are underlined in red.)

(Today's Fed Release can be found at Industrial Production
Are these signs of an economy that is "strong, and getting stronger"? At best, much of this so-called "growth" has been a result of statistical manipulation, especially through the downward revision of previously published numbers.
unlawflcombatnt
The economy needs balance between the "means of production" & "means of consumption."

0 Comments:
Post a Comment
Subscribe to Post Comments [Atom]
<< Home